
A picture tells a thousand words
Did you know that 90% of information transmitted to the brain is visual? Or that visuals are actually processed up to 60,000x faster in the brain than text? The phrase ‘a picture tells a thousand words’ certainly comes to mind!
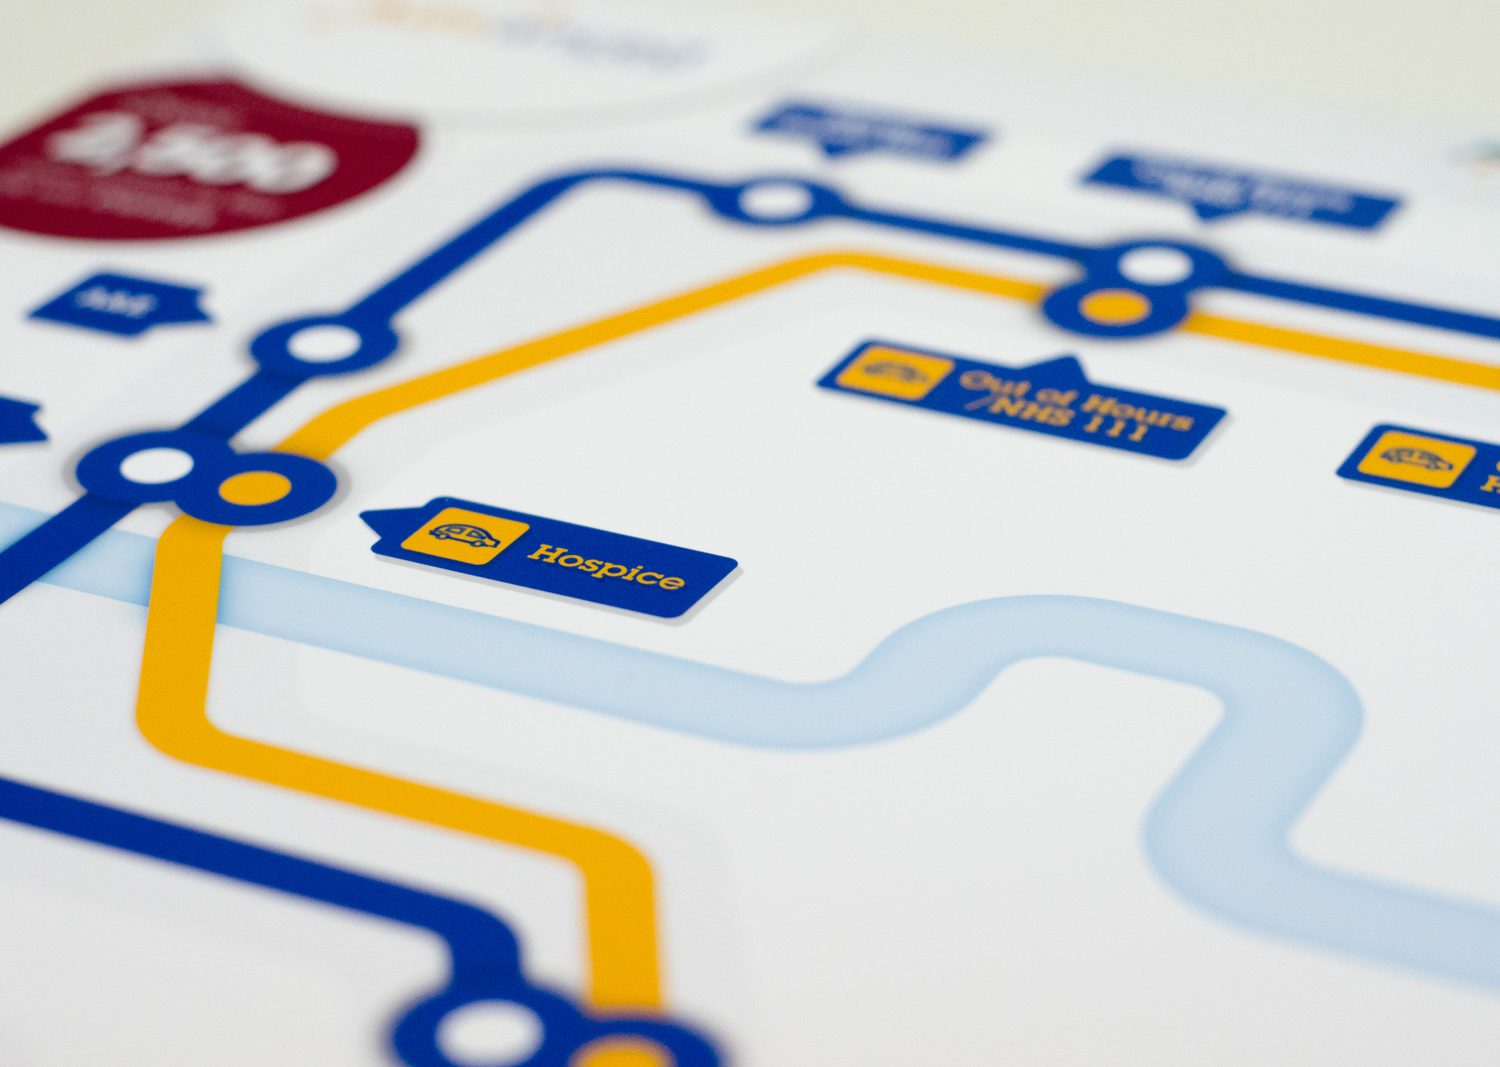
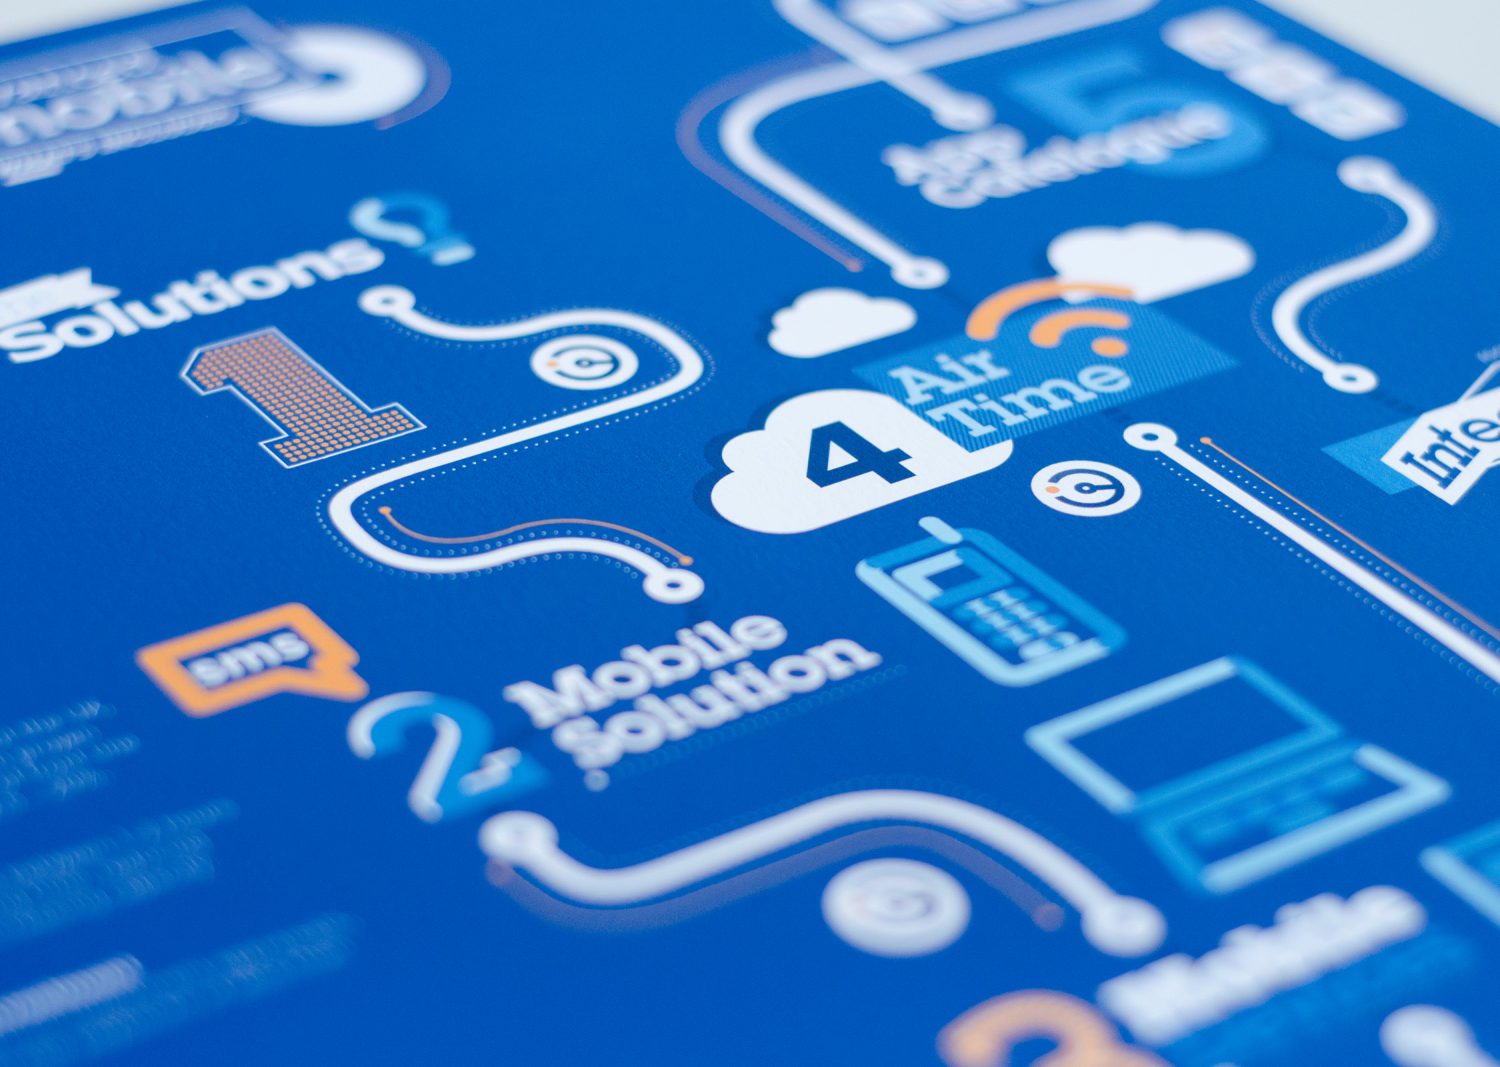
Infographics are therefore a great way to display complicated information to your users in an interesting way, and make heavy amounts of data much easier to digest. But, what is an infographic? In a nutshell, it’s a visual representation of information. Rather than providing a block of text, the information is provided to the a user in the form of an image.

A picture tells a thousand words
Did you know that 90% of information transmitted to the brain is visual? Or that visuals are actually processed up to 60,000x faster in the brain than text? The phrase ‘a picture tells a thousand words’ certainly comes to mind!
Infographics are therefore a great way to display complicated information to your users in an interesting way, and make heavy amounts of data much easier to digest. But, what is an infographic? In a nutshell, it’s a visual representation of information. Rather than providing a block of text, the information is provided to the a user in the form of an image.